Auto Insurance Statistics
Nobody likes to think about car accidents. That, however, doesn’t mean that they don’t happen, and that’s when people realize the importance of having car insurance. Did you know that inexperienced drivers, married couples, and women pay more for automobile coverage in the USA? These are just some of the auto insurance statistics and facts we will look at in this article. From average costs to market leaders, we will cover all critical aspects of the auto insurance industry that you, as a driver, must know about.
Auto Insurance Statistics (Editor’s Choice)
- In 2022, the American automobile insurance market was worth about $316.2 billion. (IBISWorld)
- At $2,996, Louisiana has the highest average car insurance rates by state. (Bankrate)
- The total liability net premiums written was $147.5 billion in 2022. (Insurance Information Institute)
- Annual car insurance quotes offered to women are $55 higher than offers given to men. (Business Insider)
- Monthly car insurance costs for teenagers go up to $386. (Business Insider)
- The number of American auto insurance businesses reached 1,528 in 2022. (IBISWorld)
Global Auto Insurance Stats
1. In 2020, the value of total premiums written on the European market was €149 billion.
This figure has been growing year-on-year since 2013, reaching a peak in 2019. That year, the written motor insurance premiums soared to €149 billion. This represents an increase of $20 billion over 10 years, according to auto insurance industry statistics.
(Statista)
2. Younger drivers pay higher rates for car insurance in the United Kingdom.
A driver of about 20 years would pay an average of £851. The average premium price among UK drivers in their 30s is £639. This isn’t surprising as most countries have the same rules, where younger drivers are considered a higher risk.
(Statista)
3. The average price for car insurance in Italy is under €400.
Italians pay an average of €350 for auto insurance. There are, however, considerable regional differences, according to car insurance facts. For example, residents of Campania have to fork out about €529 to insure their vehicles. Other regions where Italians pay above the national average include Tuscany and Lazio.
(Statista)
4. British Columbia is the Canadian province with the highest annual average car insurance cost.
British Columbia’s average premium in 2018 was C$1,680. Next came Ontario and Alberta, with respective averages of C$1,445 and C$1,251. In 2018, the net auto insurance premiums written in Canada amounted to almost $24 billion. One of the more curious auto insurance facts about Canada is that Co-operators and Alberta Motor Association are the country’s highest-rated providers of automobile coverage.
(Statista)
5. The car insurance market growth in Australia was 0.7% between 2017 and 2022.
Statistics show that the market size for car insurance in Australia has grown to $23.4 billion. Moreover, the estimated y-o-y growth in 2022 is 1.8%. This marks slower growth compared to the previous five-year period, as well as compared to other industries in Australia. In addition, while compulsory third-party (CTP) insurance policies have decreased due to competition, overall premiums increased due to the rising number of vehicles on Aussie roads.
(IBISWorld)
American Car Insurance Statistics
6. Auto insurance companies in several states charge American women more.
Business Insider concluded that gender plays a significant role in the price Americans pay for automobile coverage. For example, in Texas, the average annual quote for men was $1,069, while for women, it was $1,124, representing a 5% difference.
These same results appeared elsewhere in the US, most notably in Ohio, Miami, and Chicago. The average price difference between annual quotes offered to men and women was $172. Six states — Hawaii, Montana, North Carolina, California, Pennsylvania, and Massachusetts — don’t allow using gender as a pricing factor for auto insurance quotes.
(Business Insider)
7. Teenagers pay the most expensive car insurance in the United States.
One of the best-known auto insurance facts is that inexperienced and young drivers pay more for coverage. American teenagers pay the absolute highest price, and their monthly car insurance costs are $345 for women and $386 for men. However, their average quote price drops significantly ($223 for women and $240 for men) as soon as they turn 20.
American women in their 30s also pay less for motor insurance ($164), while men in the same age group pay $167. Car owners in their 40s have average automobile coverage costs of $154 per month, while women and men in their 50s pay $138 and $140, respectively.
The lowest car insurance monthly price for female drivers ($136) applies to those in their sixties, while men from this age group pay $2 more than those aged 50–59, Business Insider’s auto insurance statistics reveal. As the drivers get older, their auto coverage expenditures start increasing. Americans aged 70 or more pay around $160–$195.
(Business Insider)
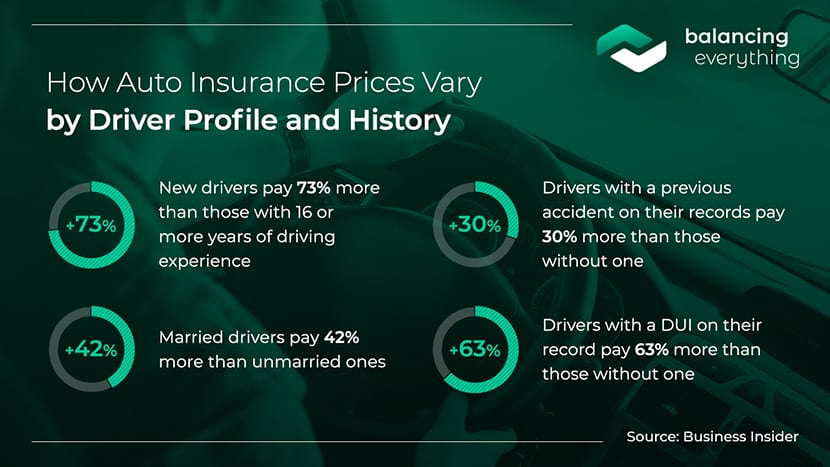
8. New drivers, married drivers, and those with accidents on their records pay more for car insurance.
New drivers pay 73% more expensive rates than those with 16 years of driving experience. Married drivers also pay more for car coverage. Their expenditures are 42% higher than those of single drivers. What you have on your record affects the price you pay for car coverage, too.
Auto insurance stats show that previous accidents and DUIs increase the average costs by 30% and 63%, respectively. In some states, like Michigan, Ohio, and Texas, even the credit score is a pricing factor. Drivers with poor credit scores may be charged $2,400, $500, or $1,500 more than drivers with excellent FICO ratings. That’s why Americans need to maintain a good credit score, as it affects various aspects of their everyday lives.
(Business Insider)
9. In 2022, New York had the highest average auto insurance rates by state.
Car owners in New York paid an average of $2,996 on car coverage, according to auto insurance statistics by state. This amount earned the state the first position when rating states from worst to best and is significantly higher than the overall average of $1,771. The top-three list was rounded up by Louisiana and Florida, whose average auto insurance expenditures were $2,864 and $2,762, respectively.
(Bankrate)
10. Louisiana, D.C., and South Dakota had the highest average costs for the three most common types of car insurance.
In 2019, the average US expenditures for liability, collision, and comprehensive auto coverage were $650.35, $381.43, and $171.87, respectively. Louisiana recorded the highest liability motor insurance average cost of $1,023.91. Car owners in D.C. paid the highest average for collision automobile insurance of $539.48. Finally, South Dakota had the highest average comprehensive car insurance of $347.61, according to official auto insurance rate(s) statistics.
(Insurance Information Institute)
11. In 2021, the total amount of liability net premiums written hit $147.5 billion.
This figure was up by 2.4% from the amount recorded in 2020. If we shift the focus to collision/comprehensive private passenger net premiums written, the improvement is even more significant. According to automobile insurance statistics, the net premiums written in this category totaled $103.78 billion in 2021, representing a 4.2% y-o-y improvement.
(Insurance Information Institute)
12. Liability insurance on bodily injuries has the highest private passenger auto insurance claim severity.
In 2021, the frequency for these claims was 0.78, while the claim severity was $22,734. The claim frequency, in contrast, for property damages was higher at 2.28, but the claim severity was much lower at $5,314. Physical damage insurance had even lower claim severities, as suggested by auto insurance claims statistics.
(Insurance Information Institute)
13. Incurred losses for car insurance dropped with the start of the pandemic.
The total incurred losses for this type of coverage in the US grew continuously from $167.9 billion in 2017 before dropping to $160.4 billion in 2020. However, the upward trend resumed afterward, growing to $196.8 billion in 2021. These total incurred losses come from the combined losses of private passenger and commercial auto insurance.
The total private passenger car incurred losses in 2021 totaled about $169.95 billion, much more than the $26.87 billion from commercial auto incurred losses. That’s another of the many car insurance fun facts. Most of the $169.95 billion came from liability coverage ($96.10 billion), while the rest came from physical damage coverage ($73.84 billion). Regarding the $26.87 billion of total commercial auto losses, liability and physical damage contributed $21.11 billion and $5.76 billion, respectively.
(Insurance Information Institute)
14. Pickups have the highest average claim severity compared to passenger cars, minivans, and SUVs.
The following data focuses on new model vehicles manufactured between 2018 and 2020. The passenger vehicle collision coverage losses are the highest for cars. Their overall loss is about $495, while for pickups and SUVs, it’s $381 and $377, respectively.
Still, these auto insurance stats show that the average claim severity is the highest ($6,925) for pickups. Passenger cars and minivans come in next with $6,831, followed by SUVs, whose claim severity is $6,816.
(Insurance Information Institute)
15. The motor vehicle insurance cost for 2012–2021 rose by 40.5%.
In 2012, motor vehicle insurance had a price index of 402.5, representing year-over-year growth of 3.6%. This segment kept increasing in the following years, only to drop from 571.0 in 2019 to 544.6 in 2020. According to the US auto insurance industry statistics, the growth for this period was a soaring 40.5%.
The only other sector whose price index grew at a similar pace was hospital services. This price index went from 253.6 in 2012 up to 363.5 in 2021. Its 10-year growth was by 43.4%. So, it’s not that surprising why the US has the highest healthcare costs by country. As for the price index of all living costs, it jumped by 18% in the 2012–2021 period.
(Insurance Information Institute)
16. The consumer price index for insurance on new vehicles increased, auto insurance facts show.
The consumer price indices for insurance of new vehicles, new cars, and new trucks increased by 8.3%, 5.4%, and 11.6%, respectively. This auto insurance data is for the period between 2012–2021. In 2021, the respective price indexes for these categories were 156.2, 152, and 166.7. The price index for used cars and trucks insurance also grew from 150.3 to 182.6, representing a 10-year increase of 21.5%. These auto insurance facts establish that owners of used cars spent more on car coverage in 2021.
(Insurance Information Institute)
17. The US auto insurance market was over $300 billion in 2022.
Its exact worth in 2022 was $316.2 billion, meaning the industry grew by 1.7%, up from about $310.9 billion in 2021. In 2019, the car insurance market in the USA was over $313.3 billion, noting a record high since 2012. In fact, the sector grew continuously year over year until the start of the pandemic, when it experienced a slight decrease. Back in 2012, the market for auto insurance in the United States was $242.6 billion.
(IBISWorld)
18. In 2022, there were 1,528 auto insurance businesses in the US.
This marks a 2.1% rise from 2021, equal to the overall growth in the 2017–2022 period. According to the IBISWorld auto insurance statistics, American automobile insurance businesses have been growing since 2012, when there were 1,313 such businesses. This number dropped only in 2017 in the following years, but it resumed its growth and reached 1,528 in 2022.
(IBISWorld)
19. State Farm Group holds the highest total private passenger auto insurance market share.
The auto insurance market share of this provider was 15.93% in 2022. Warren Buffett’s Berkshire Hathaway came in next on the list with a market share of 14.31%. Finally, Progressive Group rounded up the top-three list with a car insurance market share of 13.71%.
(NAIC)
20. Progressive Group leads the way for commercial auto insurances.
Progressive Group is a top choice for commercial auto insurance. Facts about car insurance further show that Progressive Group had a market share of 15.53% and direct premiums written worth $8.37 billion. Another surprise was the brand that held the second-highest market share – Travelers Group. This company held 5.52% of the lucrative commercial auto insurance market and noted $2.97 billion in direct premiums written. In addition, Old Republic Group was the third most popular choice, with a market share of 3.75% and direct premiums written worth $2.01 billion.
(NAIC)
Auto Insurance Fraud and Uninsured Driving Stats
21. More than half of insurers predict a rise in personal auto insurance fraud.
About 56% of car coverage providers believe that the number of auto insurance-related frauds will increase in the upcoming years. Insurance Fraud’s auto insurance fraud statistics reveal that insurers expect car insurance fraud by organized rings to rise too.
(FICO)
22. Bodily injury claims and auto glass claims are the most common types of car insurance fraud.
Reports show that providers lose almost $29 billion in premium leakage annually. Among these, $10 billion goes to unrecognized drivers, $5.4 billion to underestimated mileage, $3.4 billion to violations, and $2.9 billion to false garaging.
False car glass claims are the main issue for insurers in Arizona, where 10% of all claims happen. These include repairing or replacing windshields that don’t need any work.
(Verisk, NICB)
23. Over 7% of false auto insurance claims were identified within 125 days.
Auto insurance statistics show that about 7.4% of such claims were detected in four months or so. In about 21.5% of the cases, insurers couldn’t identify the policyholder or place them at the provided garaging address. However, the car insurance fraud rates dropped by 13.6% after 2012 when the no-fault auto-insurance reforms (HB 119) were enacted.
(Verisk, FLOIR)
Final Thoughts
Single middle-aged men without any accidents or DUIs on the record get the best car insurance rates in the US. That’s one of the major takeaways from this list of international and American auto insurance statistics. We also established that the automobile coverage cost has been increasing yearly. This means drivers can expect this upward trend to continue in the upcoming years too.
References: Statista, Statista, Statista, Statista, Statista, IBISWorld, IBISWorld, Business Insider, Bankrate, Insurance Information Institute, IBISWorld, IBISWorld, NAIC, FICO, Verisk, NICB, Verisk, FLOIR


Leave a Reply