Construction Industry Statistics
The construction market in the US—one of the largest in the world—is at a particularly critical juncture, with both major challenges and opportunities. The last decade has been a roller-coaster ride for the construction industry. The following construction industry statistics promise a future just as interesting. This article focuses on the industry’s critical aspects, including its growth potential, employment figures, safety-related data, and cost overruns caused by waste. Read on for a comprehensive picture of the state of the construction industry in the US.
Top Construction Industry Statistics (Editor’s Choice):
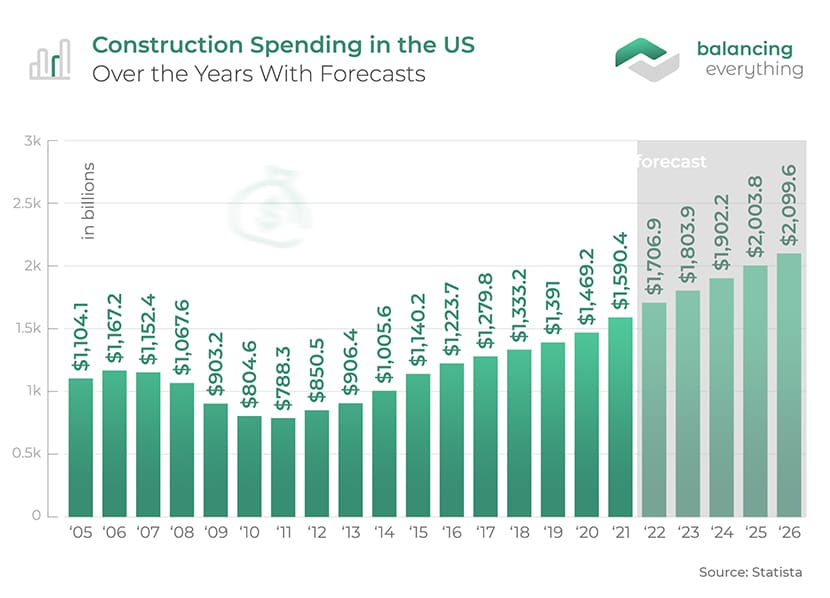
- Construction spending in the US will be worth $1.8 trillion by 2025. (Statista)
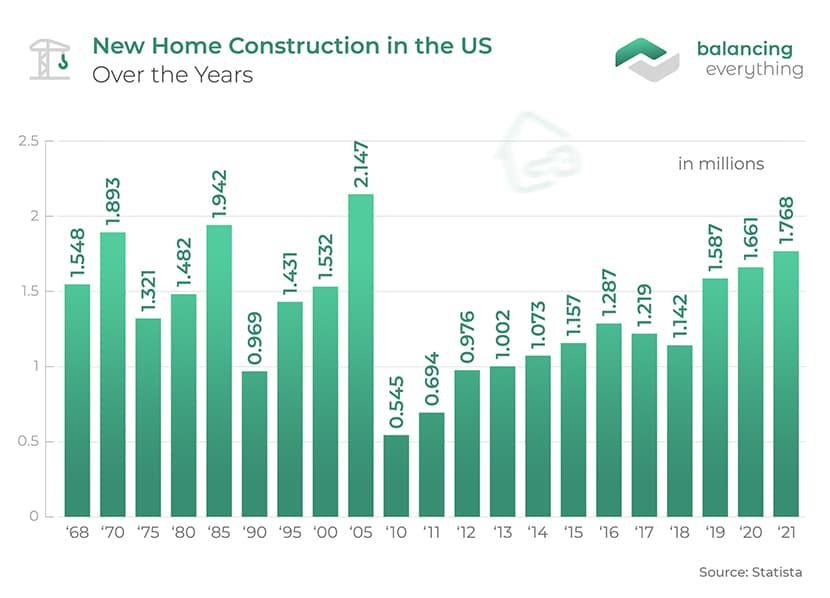
- US new home construction jumped nearly 70% from 2020 to 2021. (Statista)
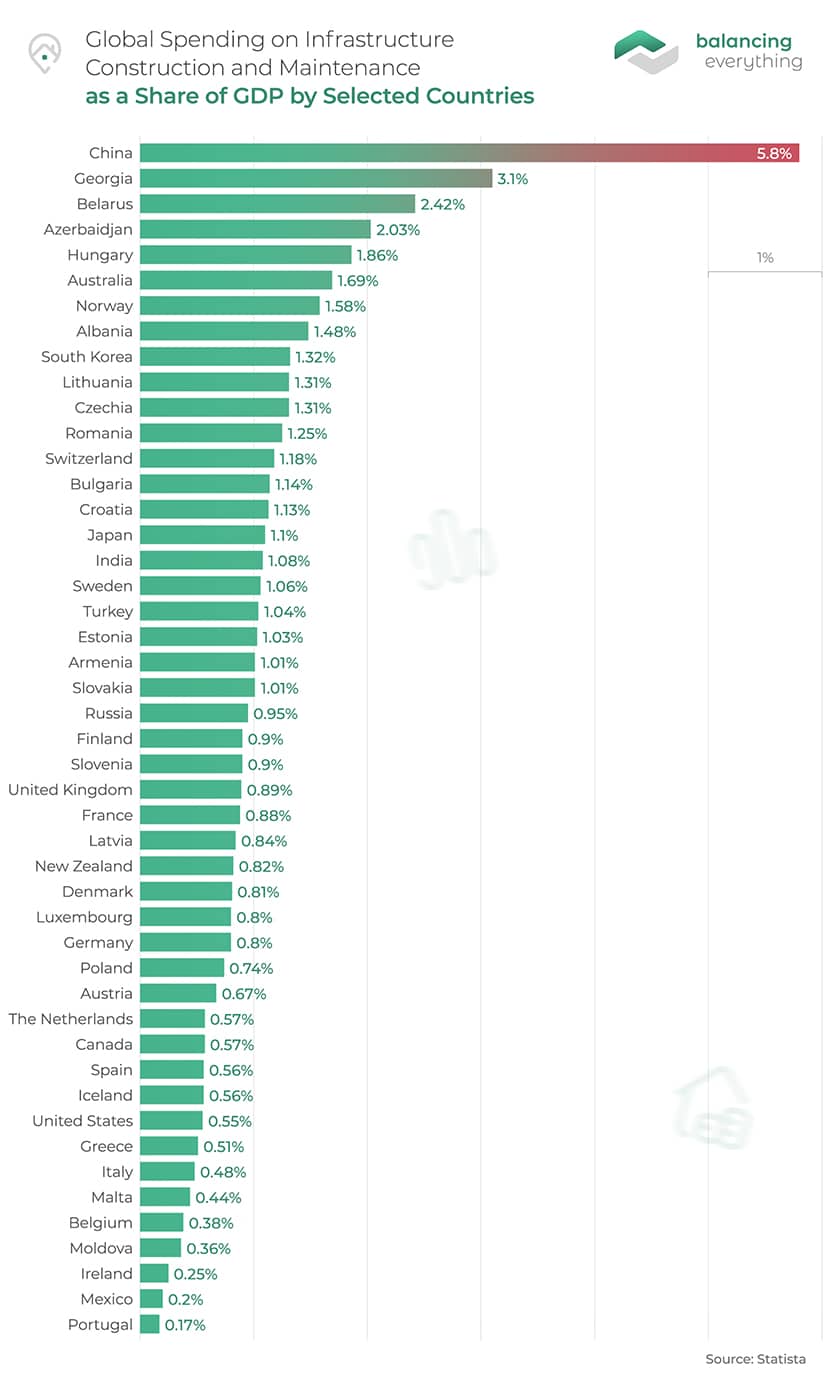
- The US spends one-tenth on infrastructure in terms of GDP share compared to China. (Statista)
- The US construction industry needs 2.2 million workers in the next three years. (Business Insider)
- The annual cost of fatal construction injuries in the US is $5 billion. (Midwest Economic Policy Institute)
- Buildings account for 37% of energy-related CO2 emissions globally. (Global Alliance for Buildings and Construction)
Construction Industry Facts
1. Total annual construction spending in the US was estimated to be $1,677 billion in January 2022.
Until late 2019, experts predicted a slowdown in US construction spending. While overall spending saw a drop in early 2020, there has been a consistent uptick since, despite the negative impact of the pandemic on all industries. The January 2022 figures marked an increase of 8.2% over the prior-year period.
(US Census Bureau)
2. US construction spending is estimated to reach $1,797 billion by 2025.
Despite the impact of COVID-19, construction stats suggest that industry spending will continue growing in the near future, achieving a CAGR of over 4% between 2020 and 2025. Note that these construction industry growth predictions are from 2020, and the actual figures for 2021 and 2022 have already surpassed estimates. This indicates that the final spending numbers by 2025 are also likely to be notably higher.
(Statista)
3. Value added by the construction industry accounted for 4.3% of the US GDP in 2020.
Value added is the enhancement of products or services before they are offered to customers. At a 4.3% share, the industry is a critical contributor to the US GDP, construction facts show. At the same time, this is markedly lower than the industry’s 5%+ share before 2007 and the subsequent financial meltdown. This share was the lowest (3.4%) between 2011 and 2012 but has almost consistently risen ever since.
(Statista)
4. New home construction in the US in April 2021 was about 67% higher year-on-year.
New home construction reached its lowest point (505,000 units) in early 2009 in the wake of the global financial crisis. The more-or-less consistent growth in the size of the construction industry since then saw another significant drop in early 2020 — from about 1,617,000 units in January to 1,269,000 units in March. Construction statistics point to an even faster recovery since then, despite pessimistic predictions from experts. This growth in the construction industry size is expected to continue in the near future.
(Statista)
5. Of the total annual construction spending in the US, almost 80% is private spending.
Spending on private construction in the US was at a seasonally adjusted annual rate of $1,326.5 billion as of January 2022. The total expenditure is roughly equally divided between residential and nonresidential spending. As expected, however, much of the residential spending (nearly 99%) is private. Most public spending ($341.7 billion) is on nonresidential construction. Construction industry statistics also show a significant portion of private spending ($497.2 billion or 37% of private spending) going into nonresidential construction.
(US Census Bureau)
6. At 5.56%, China spends the largest share of its GDP on infrastructure construction and maintenance.
By contrast, the US spends only 0.55% of its GDP on construction and maintenance activities. According to the IMF, the nominal GDP in 2021 of the US and China was $23 trillion and $17 trillion, respectively. Some of the other prominent countries with figures higher than the US are Australia (1.69%), India (1.08%), Turkey (1.04%), Japan (0.95%), and the UK (0.91%). One of the key facts about the construction industry in the US is the dire need for an increase in spending to repair the aging infrastructure.
(Statista)
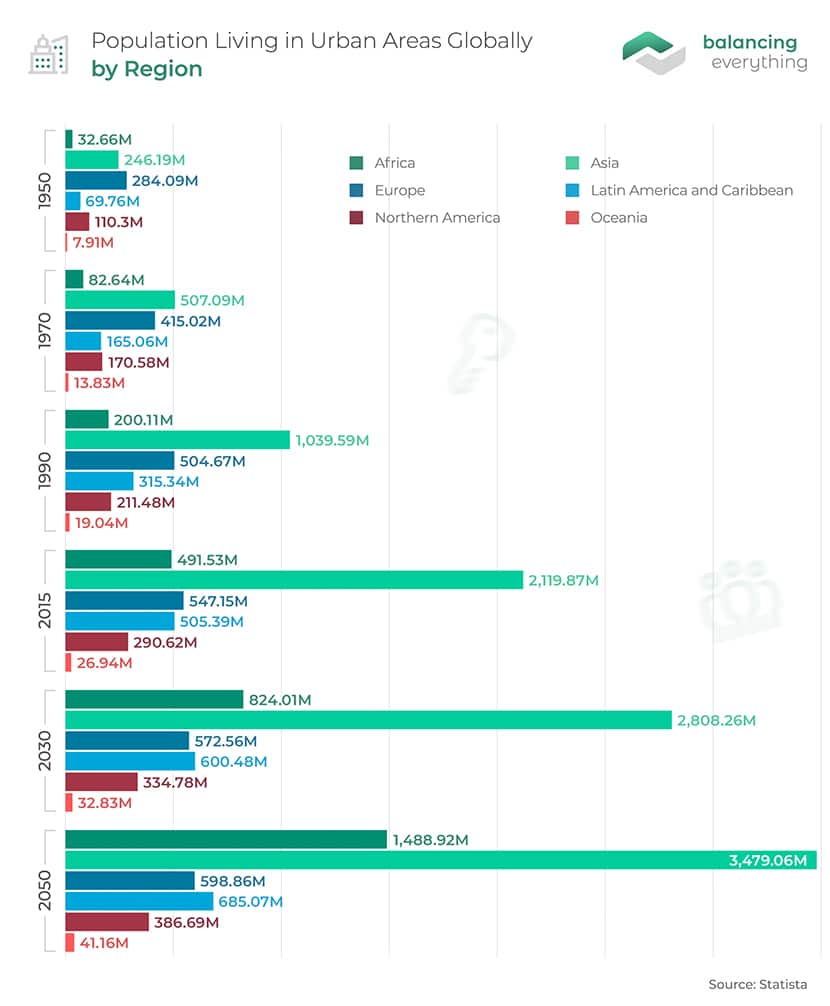
7. By 2050, nearly 6.7 billion people will live in urban areas.
A massive increase from about 4 billion in 2015, with the most significant contribution coming from Asia (nearly 3.5 billion in 2050). Similarly, the urban population in Africa will grow almost three times, from 491 million in 2015 to 1490 million in 2050. In North America, the urban population was about 110 million in 1950, rose to 290 million in 2015, and is expected to reach about 390 million by 2050. This rapid urbanization could lead to a spurt in construction industry revenue but also present challenges.
(Statista)
Construction Industry Employment Statistics
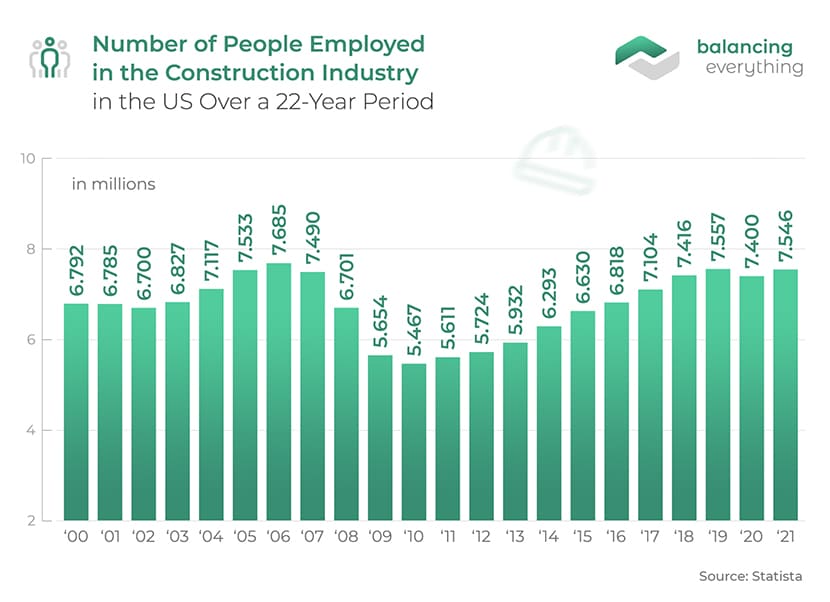
8. The construction sector employs over 7 million people in the US.
While this figure for mid-2021 was slightly lower than for earlier months, the number of people employed in Construction has steadily risen since early 2011. The early days of the pandemic saw a sudden drop to around 6.5 million; however, there was an equally quick recovery as demand for houses increased.
(Statista)
9. Hispanic workers make up 28.6% of the US construction workforce.
In contrast, the share of Hispanic workers in the general US workforce is 16.4%. US construction industry demographics stats, meanwhile show that workers in this sector are also more likely to be foreign-born (24.7%) than the general US workforce (17.1%). Women in construction, statistics show that they comprise less than 10% of the workforce, compared to a much higher figure of 46.8% in the overall US workforce.
(The National Institute of Occupational Safety and Health)
10. Baby boomers comprise about 23% of the US construction workforce.
Statistics show that construction industry employees in the US are slightly older than the national average, with 40% belonging to Generation X and only 37% being millennials. The lower enthusiasm among the younger generation to join the industry is one of the reasons for the labor shortage construction companies face. Construction stats also point to the drop in immigration to parts of the US that traditionally rely on skilled migrants.
(Statista)
11. The US construction industry needs 2.2 million more workers over the next three years.
The demand for new homes has surged during the pandemic thanks to home improvements, people retiring ahead of schedule, and millennials reaching peak years of household formation. In a time of booming demand, the lack of a sufficient qualified workforce is a limiting factor. These construction labor shortage statistics include requirements in related professions like carpenters and electricians. Construction accounting is another area where experienced professionals are in demand.
(Business Insider)
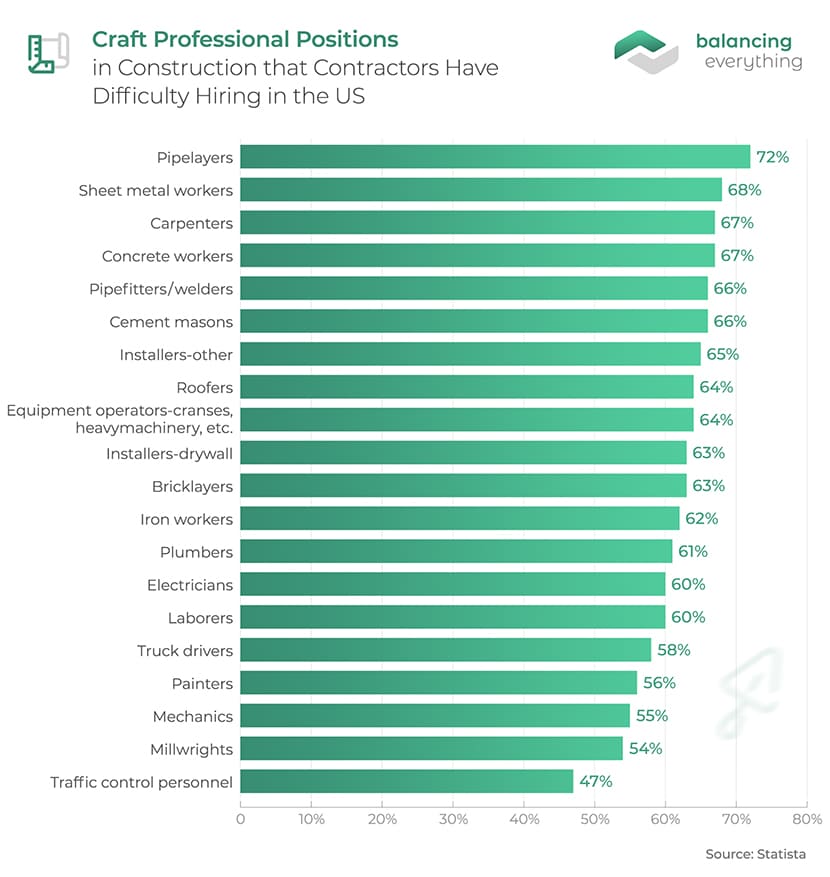
12. More than 70% of construction contractors report difficulty hiring pipelaying professionals.
However, pipelayers are not the only professionals that contractors have difficulty finding. The difficulties in filling professional positions in the construction industry are evident across the board. For instance, a survey of leading contractors in the US reveals that 68% face difficulty hiring sheet metal workers, with similarly high figures for carpenters (67%), concrete workers (67%), pipefitters/welders (66%), and cement masons (66%).
(Statista)
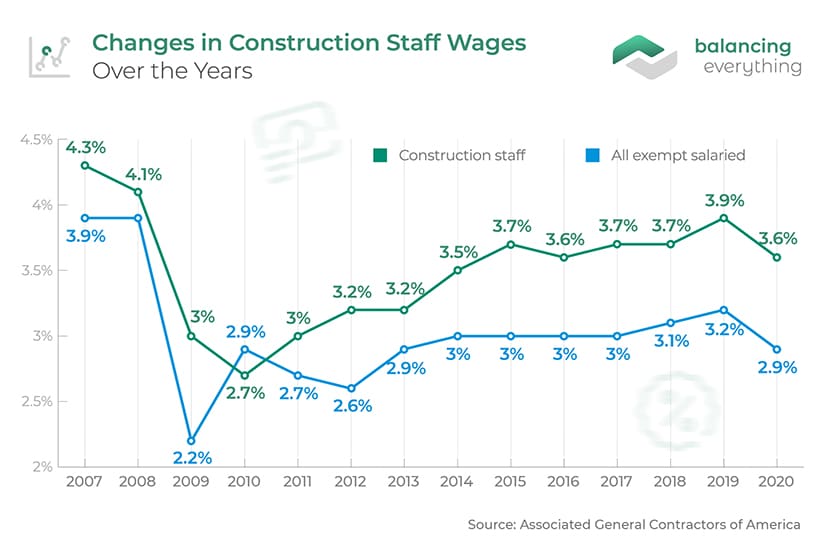
13. Construction statistics show an average salary increase of 3.4% in 2020 compared to the average growth of 2.9% across all industries.
One way companies are tackling the labor shortage in construction is by offering higher wages, along with more benefits and on-the-job training. Interestingly, construction salary increases have consistently outpaced the overall industry figures since 2010. Construction salary increases in 2021 are also expected to have averaged 3.3%, higher than the all-industry average of 2.9%.
(Associated General Contractors of America)
Construction Safety Statistics
14. Construction accounted for over 1,000 fatal injuries in 2020, the highest across all industries.
The other industries in the top three on this parameter are transportation and warehousing (805 fatalities) and agriculture, forestry, fishing, and hunting (511). However, in terms of fatal work injuries per 100,000 full-time workers, construction was in the third position at a rate of 10.2. Agriculture (21.5) and transportation (13.4) scored worse on this parameter, while other industries, such as wholesale trade (4.6), leisure and hospitality (2.5), and manufacturing (2.3), proved much safer.
(US Bureau of Labor Statistics)
15. One in three construction-related fatalities is caused by falls.
Per construction accident statistics, falling from a height is responsible for a little over 36% of deaths in construction in the US. Such incidents also increased nearly 5.4 percentage points over the previous year. The other prominent causes of fatalities, according to the latest statistics, are struck-by incidents (15.4%), electrocutions (7.2%), and caught-in/between incidents (5.4%).
(The Center for Construction Research and Training)
16. Fatalities among Hispanic construction workers have risen by about 90% in the past decade.
This increase has far outpaced the 55% growth in the number of Hispanic workers employed in construction. In contrast, fatality figures among non-Hispanic workers have remained roughly constant over this period. Construction injury statistics also show that small employers with fewer than 20 employees account for 75% of fall-related construction fatalities. Since such employers make up only 39% of construction payroll employment, the significantly higher share of fatal accidents indicates a laxer attitude to safety.
(The Center for Construction Research and Training)
17. Fatal construction injuries cost the US an estimated $5 billion annually.
These costs include healthcare expenses, lost income and production, and reduced life quality for family members. Additionally, research by Liberty Mutual shows that workers’ compensation claims for nonfatal injuries account for $2.5 billion annually. On the other hand, OSHA figures reveal that companies save $4 to $6 for every $1 invested in safety and health programs.
(Midwest Economic Policy Institute)
Construction Waste Statistics
18. Building material will account for over 1 billion tons of solid waste generated annually by 2025.
The total solid waste generated by cities is expected to rise to 2.2 billion tons worldwide by 2025, about half of which will come from construction-related activities. These activities include the demolition of buildings, real estate renovations, and building roads and flyovers. As countries become more conscious of sustainable development, policies are being formulated to increase construction waste recycling.
(Transparency Market Research)
19. The C&D debris generated in the US in 2018 was more than 2x the amount of municipal solid waste generated.
According to the latest construction industry waste statistics from the US EPA, of the 600 million tons of construction and demolition (C&D) debris generated in 2018, more than 90% came from demolition activities. Of these, a little under 145 million tons were sent to landfills. More focused steps are needed to direct more of this waste to subsequent use as it helps reduce building project expenses, creates employment in recycling industries, reduces environmental issues, and conserves landfill space.
(US Environmental Protection Agency)
20. Recycling asphalt saves the US taxpayer over $2.5 billion yearly.
Construction waste statistics objectively prove the benefits of recycling and avoiding dumping C&D waste in landfills. Apart from the above data point from the National Asphalt Pavement Association, stats from the Construction & Demolition Recycling Association reveal that 4,300 acres of landfill space are saved by recycling 538 million tons of C&D waste. Per the US EPA, recycling C&D materials has also created over 200,000 jobs in the US.
(Rubicon)
21. Buildings accounted for 36% of global energy demand and 37% of energy-related CO2 emissions in 2020.
These figures represent significant improvements over 2015. However, if the effect of the COVID-19 pandemic is excluded, the decarbonization levels in 2020 are at only 40% of the 2050 reference path to achieve the Paris Agreement goals. Construction pollution statistics also raise the fear that the levels will go back up with the post-pandemic resumption in economic activity.
(Global Alliance for Buildings and Construction)
22. Investment in building energy efficiency worldwide reached more than $180 billion in 2020, up from $129 billion in 2015.
However, most of this increase was in a few European countries. The absence of broader investment is likely insufficient to tackle efficiency improvements in the existing global building stock. Recent construction industry data also raises concerns as 82% of the population to be added by 2030 will live in countries without stringent building energy codes.
(Global Alliance for Buildings and Construction)
23. Thefts result in losses of up to $1 billion per year to the US construction industry.
Construction cost overrun statistics from agencies like the National Equipment Register estimate that losses from equipment theft alone amount to almost $400 million. Common reasons that make construction sites particularly vulnerable to thefts include the ease of access to valuable materials, lack of security, remote locations of many projects, and significant downtimes.
(Twenty20 Solutions)
24. Lumber prices topped $1,515 per thousand board feet over the pandemic from $350-$500.
Incidents of theft have seen a particular surge in recent times because the housing boom during the pandemic has been coupled with an unprecedented increase in the prices of materials. Construction site theft statistics show that this makes theft and resale on the black market even more lucrative.
(Fortune)
25. More than 80% of US construction companies have not implemented process automation.
A survey of leading representatives of construction project owners and contractors showed that an additional 12% had just started implementing robotic process automation or digital labor systems by 2017. Such statistics point to the significantly slow adoption of new technologies like construction accounting software and robotics in the US construction and engineering industry.
(Statista)
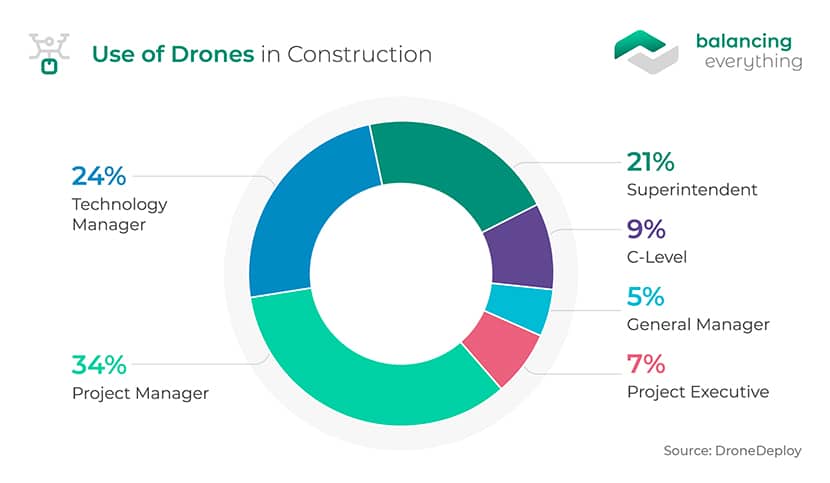
26. Construction is the fastest-growing commercial adopter of drone technology in the US.
Despite the previous point, the construction and engineering industry is at the forefront of adopting some technologies. Drones are often used in construction to collect real-time data and improve project tracking through much faster mapping.In terms of using drones in construction, statistics from 2017 show an increase in use at job sites by 239% over the previous year. It’s significantly higher than the figures of 198%, 172%, 171%, and 118% for mining, agriculture, surveying, and real estate, respectively.
(DroneDeploy)
The Bottom Line
The construction industry is a crucial driver of economic growth in the US and globally. Therefore, it needs to continue improving on fronts like worker and environment safety, waste control, and technological adoption. The construction industry statistics above indicate tremendous potential for growth; however, it is equally clear that much-needed improvements will have to come through as well for this potential to be achieved.
References: US Census Bureau, Statista, Statista, Statista, Statista, Statista, The National Institute of Occupational Safety and Health, Statista, Business Insider, Statista, Associated General Contractors of America, US Bureau of Labor Statistics, The Center for Construction Research and Training, Midwest Economic Policy Institute, Transparency Market Research, US Environmental Protection Agency, Rubicon, Global Alliance for Buildings and Construction


Leave a Reply