US National Debt by Year – Statistics & Facts
The growing debt of the United States has been a matter of discussion for several years. Given the country’s position as the world’s biggest economy, this issue impacts everyone’s lives.
These essential statistics on the US national debt by year give a detailed understanding of the issue. How and why has the US national debt grown over the years? What is the current situation? What risks, if any, could come about as a result of this growing national debt? Read on to learn the answers to all these questions and more.
Stats on the US National Debt by Year (Editor’s Choice)
- In September 2022, the total US public debt hit $30.9 billion. (US National Debt Clock)
- The US interest on the national debt is projected to be $305 billion in 2022. (The Balance)
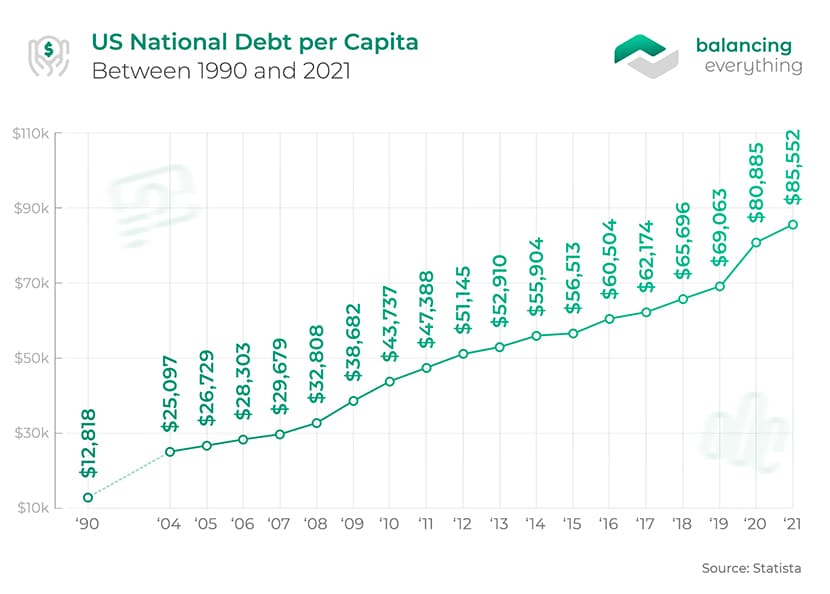
- The US per capita national debt in 2021 stood at $85,552. (Statista)
- Interest payments are the US government’s 6th largest budgetary expense as of 2022. (US Government Spending)
- Japan holds the most of the US national debt ($1,303 billion). (Investopedia)
- In terms of Dollar value, Barack Obama was the US President who grew the debt burden the most. (The Balance)
- The wars in Afghanistan and Pakistan have cost the US more than $2.3 trillion. (The Brown University)
General US National Debt Statistics
1. The outstanding national debt of the USA in 2021 was $28.43 trillion.
The growing public debt of the US has been a matter of concern for a long time. The annual national debt figures show that this problem has become particularly grave since the recession of 2008. The US national debt in 2008 was $10 trillion and has more than doubled since. Note that the US government’s fiscal year ends in September.
(Statista)
2. In September 2022, the total US national debt hit $30.9 trillion.
The main reason for the growth of US debt over the years has been the spending on new governmental programs coupled with tax cuts. Between 2020 and 2022, however, the main factor was the government’s COVID-19 response. Despite widespread worry about America’s growing debt, the concerned authorities have failed to control the rising figure.
(US National Debt Clock)
3. The US interest on the national debt is projected to be $305 billion in 2022.
One of the greatest problems with having a large amount of debt owed to the public is the annual expenditure on interest payments. With the national debt year by year growing, this expenditure is also on the rise.
The USA’s annual interest payment is larger than the entire GDP of over 160 countries. In 2022, this payment would account for 5% of the federal budget, taking away money from more important expenditures.
(The Balance)
4. Adding unfunded obligations takes the federal government’s total obligations to $202 trillion as of September 2022.
While unfunded obligations, such as mandatory payments for programs like Medicare, Medicaid, and Social Security, are not counted as part of current US debt by the US Treasury, they are additional payouts that will need to be funded through taxes or borrowing. Approximately $171 trillion related to these areas takes the total obligations of the US government to $202 trillion.
(ALEC, US National Debt Clock)
5. The US per capita national debt in 2021 stood at $85,552.
It’s also worrisome that the country’s per capita debt has climbed more than twice since 2008 when it was $32,808, and more than four times since 2000 when it stood at $19,948. With the US debt year by year growing, in 2019, the nation’s debt per capita exceeded its GDP per capita. The country’s gross national product per capita meanwhile stood at $69,000.
(Statista)
6. In 2021, the US national debt was 132.63% of the country’s GDP.
A high debt-to-GDP ratio is generally considered an indication that it will be difficult for the country to repay all its debt. Typically, a country’s national debt rises in times of war or recession. The ratio of US debt to GDP reached its peak right after World War II (113%) but fell over the next few decades. Estimates currently place it at about 124.52% for 2022.
(Statista, US National Debt Clock)
7. In 2021, the US had the 11th highest national debt to GDP ratio in the world.
The country with the highest debt-to-GDP value in the same year was Venezuela (306.95%). The remaining countries in the top 10 were Japan (263.14%), Greece (198.93%), Sudan (184.34%), Eritrea (170.82%), Cabo Verde (154.09%), Italy (150.86%), Barbados (135.78%), Bhutan (134.94%), and Singapore (132.81%).
Despite the current US national debt trend, the country doesn’t even rank among the top 10 in terms of debt in relation to GDP, but it might end up there after 2022.
(Statista)
8. The statutory limit on the US federal debt was raised to $31.3 trillion in December 2021.
The national debt limit or debt ceiling is a legislative cap on the debt that can be incurred by the US Treasury. It curbs the money the federal government can borrow to pay for its expenditures. This limit has consistently increased over the past three decades. The debt ceiling, which, according to US federal debt by year numbers, stood at $4.1 trillion in 1990, had risen to $11.3 trillion by 2008 and to $16.3 trillion by 2011.
(Statista)
9. Interest payments are the US government’s 6th largest budgetary expense as of 2022.
The list of budgetary expenses for 2022 shows that debt interest is a greater expense for the US government than the money spent on income security, transportation, food and agriculture subsidies, among other items. Medicare/Medicaid, social security, defense and war, pension, and education expenditures cost more than the debt interest.
(US Government Spending)
10. The 10-year Treasury note yield fell below the 1% mark for the first time in national debt history in early 2020.
The 10-year Treasury note yield is the interest the US government pays on its securities maturing in 10 years. The impact of the COVID-19 epidemic on financial markets and other factors, like the mortgage refinancing boom, pushed the yield to 0.92% in early 2020.
While this reflects a poor outlook for the world economy among global investors, it also lowers the interest burden of the US government. The current United States debt is manageable as long as the interest remains low and the economy keeps growing.
(Barron’s)
11. As of July 2022, the high federal debt and the budget deficit were considered the 9th most important economic problem, according to American citizens.
In this regard, it ranks above other economic problems like recession, the gap between rich and poor, foreign trade/trade deficit, wage issues, and taxes. There are, however, several non-economic problems, such as poor leadership, immigration, healthcare, and climate change, which rank above the concern over the current national debt in the minds of Americans.
(Gallup)
12. Since 1971, the US has seen budget deficits in 45 of 49 years, while there were only 41 years with a deficit in the preceding 70 years.
With the US national debt linked to the country’s budget deficit, it is important to understand how these deficits became more common. Before 1971, those occurred only during economic downturns or wars. In response to accelerating inflation in the late 1960s, President Richard Nixon decoupled the value of the US dollar from gold in 1971. The amount of currency that could be printed and spent had previously been limited, keeping the US debt over time largely in check.
(Forbes)
13. If the US government focused all of its income on debt repayment, it could pay off all of its debts in about 6 years.
The latest figures from the Congressional Budget Office indicate that the US government’s 2021 revenues from taxes, fines, investments, and other sources of income amounted to $4 trillion, or about 18.1% of the GDP.
So, while the US national debt by year might seem very high in Dollar terms, the US government’s revenue generation levels show that it remains serviceable, with the economy expanding at an equally fast rate. This is also why many economists do not consider the country’s rising debt that big of an issue.
(Forbes, CBvO)
14. While the US has never formally defaulted on its federal debt, technically speaking, it did default once in April 1979.
In 1979, the US defaulted on some T-bills, eventually making the payment after a short delay. This had the effect of increasing the interest rates by about 60 basis points, which remained elevated for several months. Interest rates are much lower now compared to those seen over the US debt history; however, given the huge principal, even a sign of default or a delay could significantly bump up the interest expenditure of the country.
(The Wall Street Journal)
Debt Held by Foreign Creditors
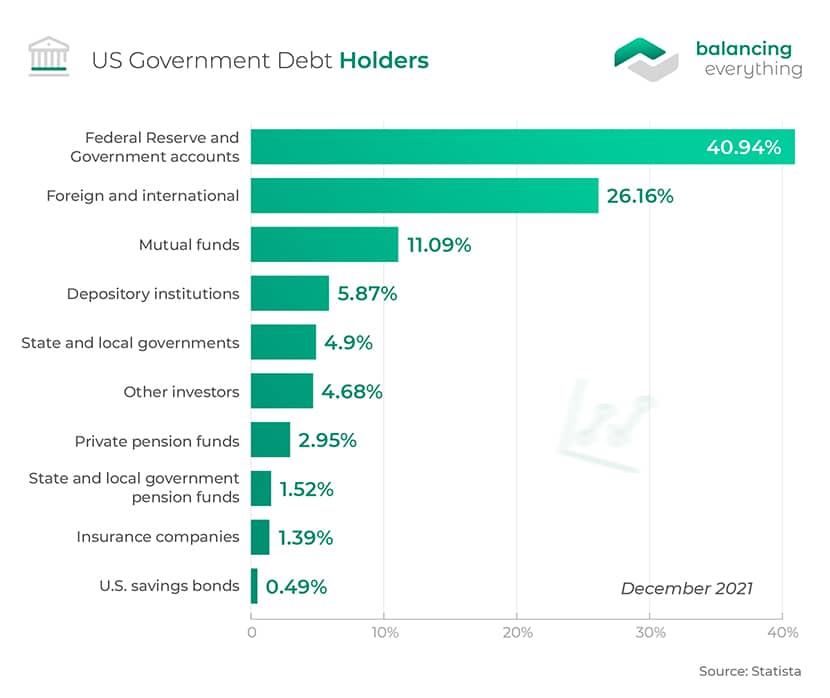
15. 26.16% of the US government debt was owned by foreign and international institutions in December 2021.
As of December 2021, the largest component of the US government debt — 40.94% — was owned by the federal reserve and government accounts. However, it is the foreign-held debt that could be a matter of concern. According to the national debt chart, 11.09% is held by mutual funds, 5.87% by depository institutions, 4.9% by state and local government, etc.
(Statista)
16. Japan is the largest holder of US treasury securities, valued at $1.3 trillion in May 2022.
Other countries with significant holdings are China (approximately $1 trillion), the United Kingdom ($647.4 billion), Ireland ($334.3 billion), and Luxembourg ($325.6 billion).
The large foreign holdings of the national debt of the United States leave the country vulnerable in the event of a shock, such as a collapse in housing prices or an extreme national security breach. There are other concerns, as well, when foreign countries, including potentially antagonistic ones, hold a large portion of the country’s securities.
(Investopedia)
17. China has held more than $1 trillion in US national debt since 2010.
The manner in which the US Department of Treasury measures debt changed in 2010, which makes the comparison with debt holdings before 2010 difficult. Holding a large amount of US Treasury bonds has helped China keep its currency undervalued. Beijing, however, has been trimming its holdings over the last two years, and if it calls in its debt in large amounts, US interest rates would rise and slow down economic growth.
(The Balance)
National Debt by President
18. In terms of Dollar value, Barack Obama was the US President who grew the debt burden the most.
President Obama added $8.6 trillion to the nation’s debt during his two terms. Both he and President George W. Bush, who added the second-greatest amount to the US national debt, had to fight the 2008 recession and also incur higher mandatory spending for Social Security and Medicare.
The $831-billion economic stimulus package, tax cuts worth $858 billion, increased defense spending to $855 billion, and the Patient Protection and Affordable Care Act expenses were some of the key reasons for the continuous increase in national debt per year during President Obama’s terms.
(The Balance)
19. In percentage terms, the US president who grew the debt burden the most was Franklin D. Roosevelt.
While the US national debt climbed by only $236 billion in Dollar terms under President Roosevelt, the percentage increase was 1,048%. The two most significant expenses under FDR were the New Deal following the Great Depression and World War II. Similarly, the second-highest debt addition in percentage terms was under President Woodrow Wilson because of World War I.
(The Balance)
20. The wars in Afghanistan and Pakistan have cost the US more than $2.3 trillion.
Wars cost money, fuelling the growth in the US debt by year. The wars in Afghanistan and Pakistan launched under President George W. Bush after 9/11 have cost at least $2.3 trillion over the entire duration and is one of the biggest reasons for the 101% increase in US national debt under President Bush. Partly because of these wars, military spending also rose to a record level, putting further pressure on the US national debt.
(The Balance, The Brown University)
21. The US budget deficit increased to more than $2.8 trillion in 2021 from less than $1 trillion in 2019.
Two of the major reasons for the rise in the federal debt by year are that the expenditure planned by the federal government exceeds the income generated through taxes and the ongoing COVID-19 pandemics. Both have been a major source of this budget deficit. Under President Trump, there have been further major tax cuts, resulting in the budget deficit reaching 4.7% of the GDP in 2019.
(Fiscal Data, Committee for a Responsible Federal Budget)
22. According to CBO’s estimates, the budget deficit for fiscal 2022 should be significantly lower compared to the previous years.
The national debt over time appears to be slowly declining after tough times caused by the ongoing Coronavirus pandemic and war in Ukraine. The CBO published a promising report, indicating that the budget deficit for the first 11 months of the 2022 fiscal year is $944 billion. This is about $1.8 trillion less than the same period of the previous fiscal year.
(CBO)
US National Debt Growth Statistics
23. The ratio of US national debt held by the public to the US GDP is expected to reach nearly 127.41% by 2027.
According to the US debt graph based on CBO’s baseline projections, which assume that the current laws on taxation and spending will not change, the federal budget deficit is expected to increase substantially over the next few years.
The public debt-to-GDP ratio has dropped since its drastic increase in 2020 when it reached 134.24%. However, the projections show the ratio will start rising again from 2024.
(Statista)
24. Data on the US national debt by year show that gross federal debt will grow to $45.3 trillion by 2032.
For the 2022 fiscal year, the gross federal debt, which includes both public and intragovernmental debt, is expected to be $30.6 trillion, with the current levels showing that the actual figures might overshoot this estimate. The current estimate of $45.3 trillion for 2032, therefore, might prove conservative unless future administrations take measures to curb the budget deficit.
(Statista)
25. The gross domestic product (GDP) is expected to reach $36.68 billion by 2032, as per the latest national debt by year chart.
The latest estimates suggest that the US GDP will be worth $36.68 billion by 2032, resulting in continuous growth since 2021. The GDP growth had begun to slow down under President Trump because of the trade war with China. However, even without a 2008-like slowdown in the world economy in the coming decade, there is a strong chance of the GDP not matching the current forecasts for 2032.
(Statista)
Consequences of Rising National Debt by Year
26. Each percentage point above a public debt-to-GDP ratio of 77% costs 0.017 percentage points of real annual growth for a developed economy.
Economists examine the effect of high public debt, particularly in relation to the country’s GDP, on the long-term growth of its economy. There is a threshold under which a high debt-to-GDP ratio helps the economy, as there is more credit available to fund growth activities.
Beyond this limit, which is 77% for developed economies and 64% for emerging markets, debt can be harmful to a country’s economy. The US debt chart shows that the share held by the public crossed the 77% public debt-to-GDP mark in 2017.
(World Bank)
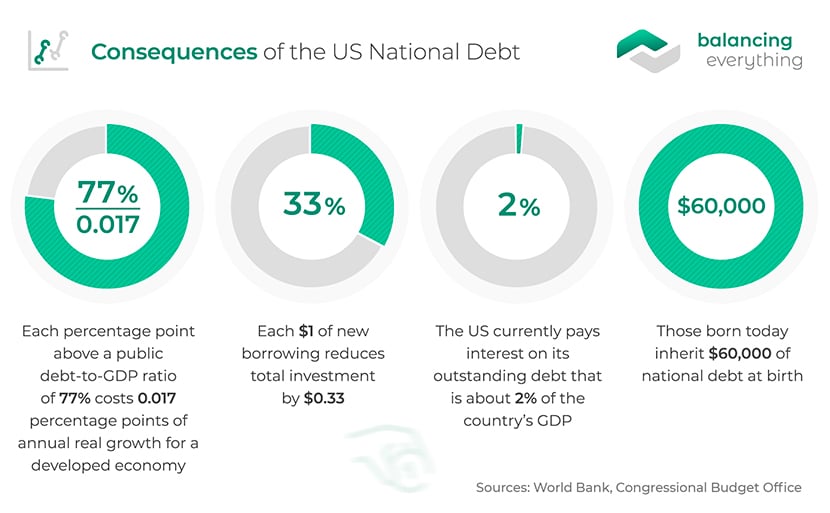
27. Each $1 of new borrowing reduces total investment by $0.33.
This slowdown occurs because of a phenomenon called “crowding out,” where investors purchase government securities instead of making productive investments into buildings, machinery, equipment, software, new ventures, etc. This impacts workers’ productivity growth and, in turn, their incomes and wages.
The CBO has projected that the Gross National Product per person will be about $98,000 in today’s dollars if the US national debt graph comes down to historical levels (about 40% of GDP). By contrast, if the debt continues rising the way it is now, the GNP per person will be $90,000.
(CBO)
28. Under current laws, the US national debt interest payments will exceed the spending on defense by 2025 and become the single largest government expenditure by 2050.
The US currently pays interest on its outstanding debt that is about 2% of the country’s GDP; under the current law, the CBO predicts this will rise to 3% by 2029. According to the CRFB, this will grow further to 6.3% of the GDP by 2050. As per the US national debt by year chart, the previous record-high was 3.2% of the GDP. This growing interest expenditure is expected to eclipse spending on other programs over time, including Medicaid in 2020.
Interest payments already consume every dollar raised through corporate income tax, estate tax, gift tax, and federal excise taxes. With unchecked debt, by the late 2040s, interest costs could consume all payroll tax revenue.
(Committee for a Responsible Federal Budget)
29. The US has 28% of GDP in fiscal space today to combat the next crisis. It will decline to 13% by 2029, according to a national debt graph.
“Fiscal space” refers to the extent of measures a country can take to combat a crisis like the last recession. The US was able to take on significant additional debt in 2008 because its pre-recession debt-to-GDP ratio was more manageable than it is now.
However, under the current laws, this ratio is expected to grow to record levels, reducing the ability to address any unforeseen challenges. While there is no definitive measure of the fiscal space, the above figures are based on a likely scenario studied by the CRFB.
(Committee for a Responsible Federal Budget)
30. US consumption on seniors is higher than spending on children in 2022, based on current US national debt by year figures.
Another major negative consequence of growing debt is that it takes away from the future generations to fuel consumption in the present, increasing the interest burden on those born today (who inherit $71,000 of the national debt at birth). The GNP, which is a rough proxy for average income per person, is expected to keep declining in the future.
(Committee for a Responsible Federal Budget)
Conclusion
These statistics on the US national debt by year show that the consistent growth in debt has not reached unmanageable proportions. Given the strength of the US economy, the likelihood of default and a resulting global financial crisis is also negligible. That said, the trend is not a healthy one and exposes both the US economy and world markets to risks. A bit of financial prudence from US lawmakers, therefore, could probably go a long way in reining in the country’s growing debt and reducing the burden on future generations.
References: Statista, US National Debt Clock, The Balance, ALEC, Statista, Statista, Statista, Statista, US Government Spending, Barron’s, Gallup, Forbes, Forbes, CBO, The Wall Street Journal, Statista, Investopedia, The Balance, The Balance, The Brown University, Fiscal DataCommittee for a Responsible Federal Budget, CBO, Statista, Statista, World Bank, CBO, Committee for a Responsible Federal Budget, Committee for a Responsible Federal Budget


Leave a Reply