Church Giving Statistics
Americans used to give more money to their church during the Great Depression than they do now. That said, church giving statistics reveal that the most significant share of all donations in the United States goes to religious organizations, including congregations, missionary societies, denominations, and religious media.
So, read on to find out the average donation size among Catholic and Methodist church attendees. Learn how social media helps religious organizations reach more people. Discover whether tithing is still a thing and how many people do it.
Church Giving Statistics (Editor’s Choice)
- 27% of donated money in 2021 went to churches. (Giving USA)
- Tithers represent about 10–25% of all congregations. (Nonprofits Source)
- Christians donate 2.5% of their income to churches. (Nonprofits Source)
- 95% of Catholics who donate money financially support their parishes. (U.S. Catholic)
- Catholic Charities USA received $1 billion through private donations in 2020. (Forbes)
- The average church donation per attendee in Methodist churches is $44 a week. (Horizons)
General Church Charity Statistics
1. 27% of donations in 2021 went to religious organizations.
This percentage noted a 5.4% growth compared to 2020. The total contributions to religious organizations were $135.78 billion. Most of the donors (67%) were people who gave money to their local churches. Almost a fifth of donations (19%) came from foundations, and 9% were given by bequest. Finally, corporations contributed 4% to the total amount.
(Giving USA)
2. Charitable giving nearly hit $484.85 billion in 2021.
Charitable giving statistics show that in the US, people donated nearly $485 billion in 2021, marking a 4% increase from 2020. The largest share of those donations (27%) went to religion. Education followed at 14%, while human services and foundations were the other popular causes with 13% each.
(Giving USA)
3. People who attend church regularly tend to donate more money to any type of cause.
Church tithing statistics show that about 81% of those who participate in religious services between 27–52 times a year contribute to religious causes. Their average donation is $2,224, while their total annual charitable giving is about $2,935. Americans who never attend religious services give less, with 50% giving to secular causes and 12% donating to religious causes. Their average donation sizes are $593 for secular causes and $111 for religious causes.
(Philanthropy Roundtable)
4. Almost half of church giving comes from credit cards.
Church charity statistics show that about 49% of all donating to churches comes from credit cards. Still, 80% of those who donate to churches carry no credit card debt. This is interesting because the credit card debt in America is over $1 trillion. These figures, however, show that those who give money are also more careful with their finances. More than half (60%) of those who donate to churches would give money digitally. Churches that accept online tithing record a 32% increase in donations.
(Nonprofits Source)
5. Tithers represent about 10–25% of congregations.
Only 5% of Americans are tithers. Most (80%) give about 2% of their income to tithing donations. About 3–5% of those who attend and donate to churches do so through tithing. 17% of Americans responded that they tithe regularly. Tithe statistics reveal that most tithers (77%) donate 11–20% of their income. This tithing percentage is much higher than the baseline of 10%. About 70% of tithers base donations on gross income rather than on net income.
(Nonprofits Source)
6. Christians these days give 2.5% of their income, which is less than how much they gave in the past.
During the Great Depression, they gave a higher share of 3.3%. Only 1% of Households making over $75,000 contribute with tithing amounts of at least 10% of their income. Christian church charity statistics demonstrate that 17% of American households currently give less than they used to in local church donations. For 7% of regular churchgoers, the amounts donated dropped by 20%.
(Nonprofits Source)
7. Twitter is helping churches reach more people and collect more donations.
About 23% of American pastors and one in five (21%) churches use Twitter. The platform’s users redirect 700% more visitors to donation pages on Giving Tuesday compared to other days. Around 55% of Twitter users engaging with churches and nonprofits end up taking actions like online tithing or donating.
(Nonprofits Source)
Catholic Church Giving Stats
8. 26% of Catholics in the US prefer acts of service to money donations.
Catholic Church charity statistics show that most believers prefer financial donations. Namely, 74% of the survey participants disagreed with the idea that doing acts of service is better than giving money to the church. Only 26% see acts of service as more helpful than providing financial support.
(U.S. Catholic)
9. Most Catholics who donate money give both to their parishes and charities unaffiliated with them.
About 88% said they financially support both their parish and other charities. Only 12% donate to their parish only. Among those who donate money, 78% give to the church. 73%, 45%, and 38% also contribute money to social justice, education, and health care, according to church charity statistics. The environment, politics, and other causes get donations by 30%, 23%, and 33% of Catholics who donate funds, respectively.
(U.S. Catholic)
10. 69% of Catholics who donate money give between 2–5% of their income.
Most Catholics who financially support churches and charitable organizations give 2–5% of their income. The U.S. Catholic charitable giving statistics show that 38% and 35% annually give at least 10% and between 5–9%, respectively. For about 5% of Catholics that donate money, less than 2% of their income goes to donations. Only 1% give no money to their churches or charities.
(U.S. Catholic)
11. 95% of Catholics give money to their parish.
Participants in the U.S. Catholic survey claimed they support their parishes financially as an appreciation token for the spiritual growth they provide. Most responders said they wanted to see their parish flourish, and providing financial support seemed like the right step for them.
Tithing statistics further show that among the 5% who don’t donate to their parish, transparency appears to be the issue. So, they prefer supporting non-parish charities that are transparent with how and where donations are spent.
(U.S. Catholic)
12. Most Catholics think fellow parish members should give more.
About 38% of believers think that less than half of their parish members give money to their parish. A significant share (84%) believe that fellow parishioners could donate more money and time to their church. Still, most Catholics claimed that they didn’t feel any pressure to give money to their parish, according to the Catholic church charity statistics.
(U.S. Catholic)
13. 26% of people who attend mass weekly donated money online.
Online church giving is more common among younger Americans. Namely, 22% of those aged 16–34 donate money online compared to 20% of those aged 35–64. About 21% of those who attend mass monthly donate to church online.
(USCCB)
14. Online donating is more common in Catholic households making at least $60,000 a year.
Online church giving statistics reveal that families that earn more money also tend to donate money online more. In fact, 36% of Catholic households making $100,000 or more give money via the Internet. Around 20% of those earning $60,000–99,000 a year use the Internet to donate funds. As for households earning less than $35,000 and between $35,000–59,000, only 12% in each category financially support their parishes online.
(USCCB)
15. Most working-age Catholics donate money online 2–11 times a year.
About 51% of participants in the USCCB survey said they donate online 2–11 times a year. Among those aged 16–34, 49% responded positively to this question. About 53% of Catholics aged 35–64 said they were donating money via the Internet in the past 12 months. Respective 4%, 13%, and 32% of all participants were donating online weekly, monthly, and once a year.
(USCCB)
16. Catholics who attend mass weekly tend to donate more money to religious organizations.
Church online giving statistics show that 80% of these people in this group give money to religious causes. About 64% of those who attend mass monthly, in contrast, do the same. Only 24% of Catholics that attend mass a few times a year or less donate money to religious organizations online. Similarly, those registered with a parish (59%) contribute more compared to those who aren’t (23%).
(USCCB)
17. More than half of Catholics would give money if asked by their pastor at mass.
More precisely, 53% of the participants responded positively to this question, show the church giving statistics. The only two options that got more positive answers were giving money to family (73%) and friends (58%). About a third (36%) claimed they would donate money if their bishop requested it via their diocesan newspaper or a mailer. A mailed letter, an email, and a phone call would be effective for the respective 31%, 21%, and 16% of the participants.
(USCCB)
18. Only a quarter of Catholics prefer donating online.
When asked whether they would prefer to give money online through a site of the Catholic Church, only 25% responded positively. Church online giving statistics show that the majority (75%) wouldn’t prefer this option. The situation is even more drastic among those aged 35–64, where 78% responded negatively to the question.
(USCCB)
19. Convenience is the main reason why Catholics prefer to donate money online.
For 71% of the participants, convenience was the main reason for giving money online. The other common reasons were monitoring finances (14%), the option to use a credit card (7%), and security (5%). Those who dislike this option said they distrust the Internet (47%), prefer to give in person (33%), and want receipts (6%). These church giving statistics show that online donating and tithing are yet to become popular among Americans.
(USCCB)
20. 42% of Catholics aged 16–34 donate $100 or less to their local parish a year.
Among all participants who regularly contributed, the shares of those who donated $100 or less (34%), between $101 and $500 (33%), and more than $500 (33%) were almost equal. The situation with the average church offering is a bit different when the participants are divided into age groups. Among those aged 16–34, 42%, 33%, and 25% donated under $100, between $101 and $500, and at least $500, respectively. Most Catholics aged 35–64 (38%) gave over $500, while 28% and 34% gave under $100 or between $101 and $500, as shown by tithing statistics.
(USCCB)
21. Most people donate under $100 a year to their parish.
USCCB dived deeper into the national church giving average per year. They discovered that 28% of participants donate $100 or less. Then, 19%, 16%, and 17% gave $101–$250, $251–$500, and $501–$1,000, respectively. About 12% claimed to donate $1,001 and $2,000 to their local parish a year. Finally, only 8% said they give at least $2,000 per year.
(USCCB)
22. People who make the most also donate the most.
Church tithing statistics established that most households that earn under $35,000 (56%) donate less than $100 a year to their parish. Only 36% and 8% give $101–$500 and over $500. Respective 42%, 39%, and 20% of families making $35,000–$59,000 annually donate under $100, $101–$500, and over $500.
As the income increases, so do donations. So, Catholic households earning $60,000–$99,000 tend to donate at least $500. This is true for 39% of such families. The remaining 25% and 36% donate under $100 or between $101–$500. Finally, 59% of households making at least $100,000 donated over $500 a year to their parish, according to Christian church charity statistics. Only 16% and 26% of families in this income category give average church donations under $100 or between $101–$500.
(USCCB)
23. Catholic Charities USA collected $1 billion in private donations in 2020.
Catholics don’t donate to their churches directly only. Many give money to Catholic church charity organizations instead. A sure leader is Catholic Charities USA, whose revenue stood at $4.32 billion in 2020. About $1.02 billion from those came from private donations and $1.32 billion from government support.
(Forbes)
Tithing in the USA
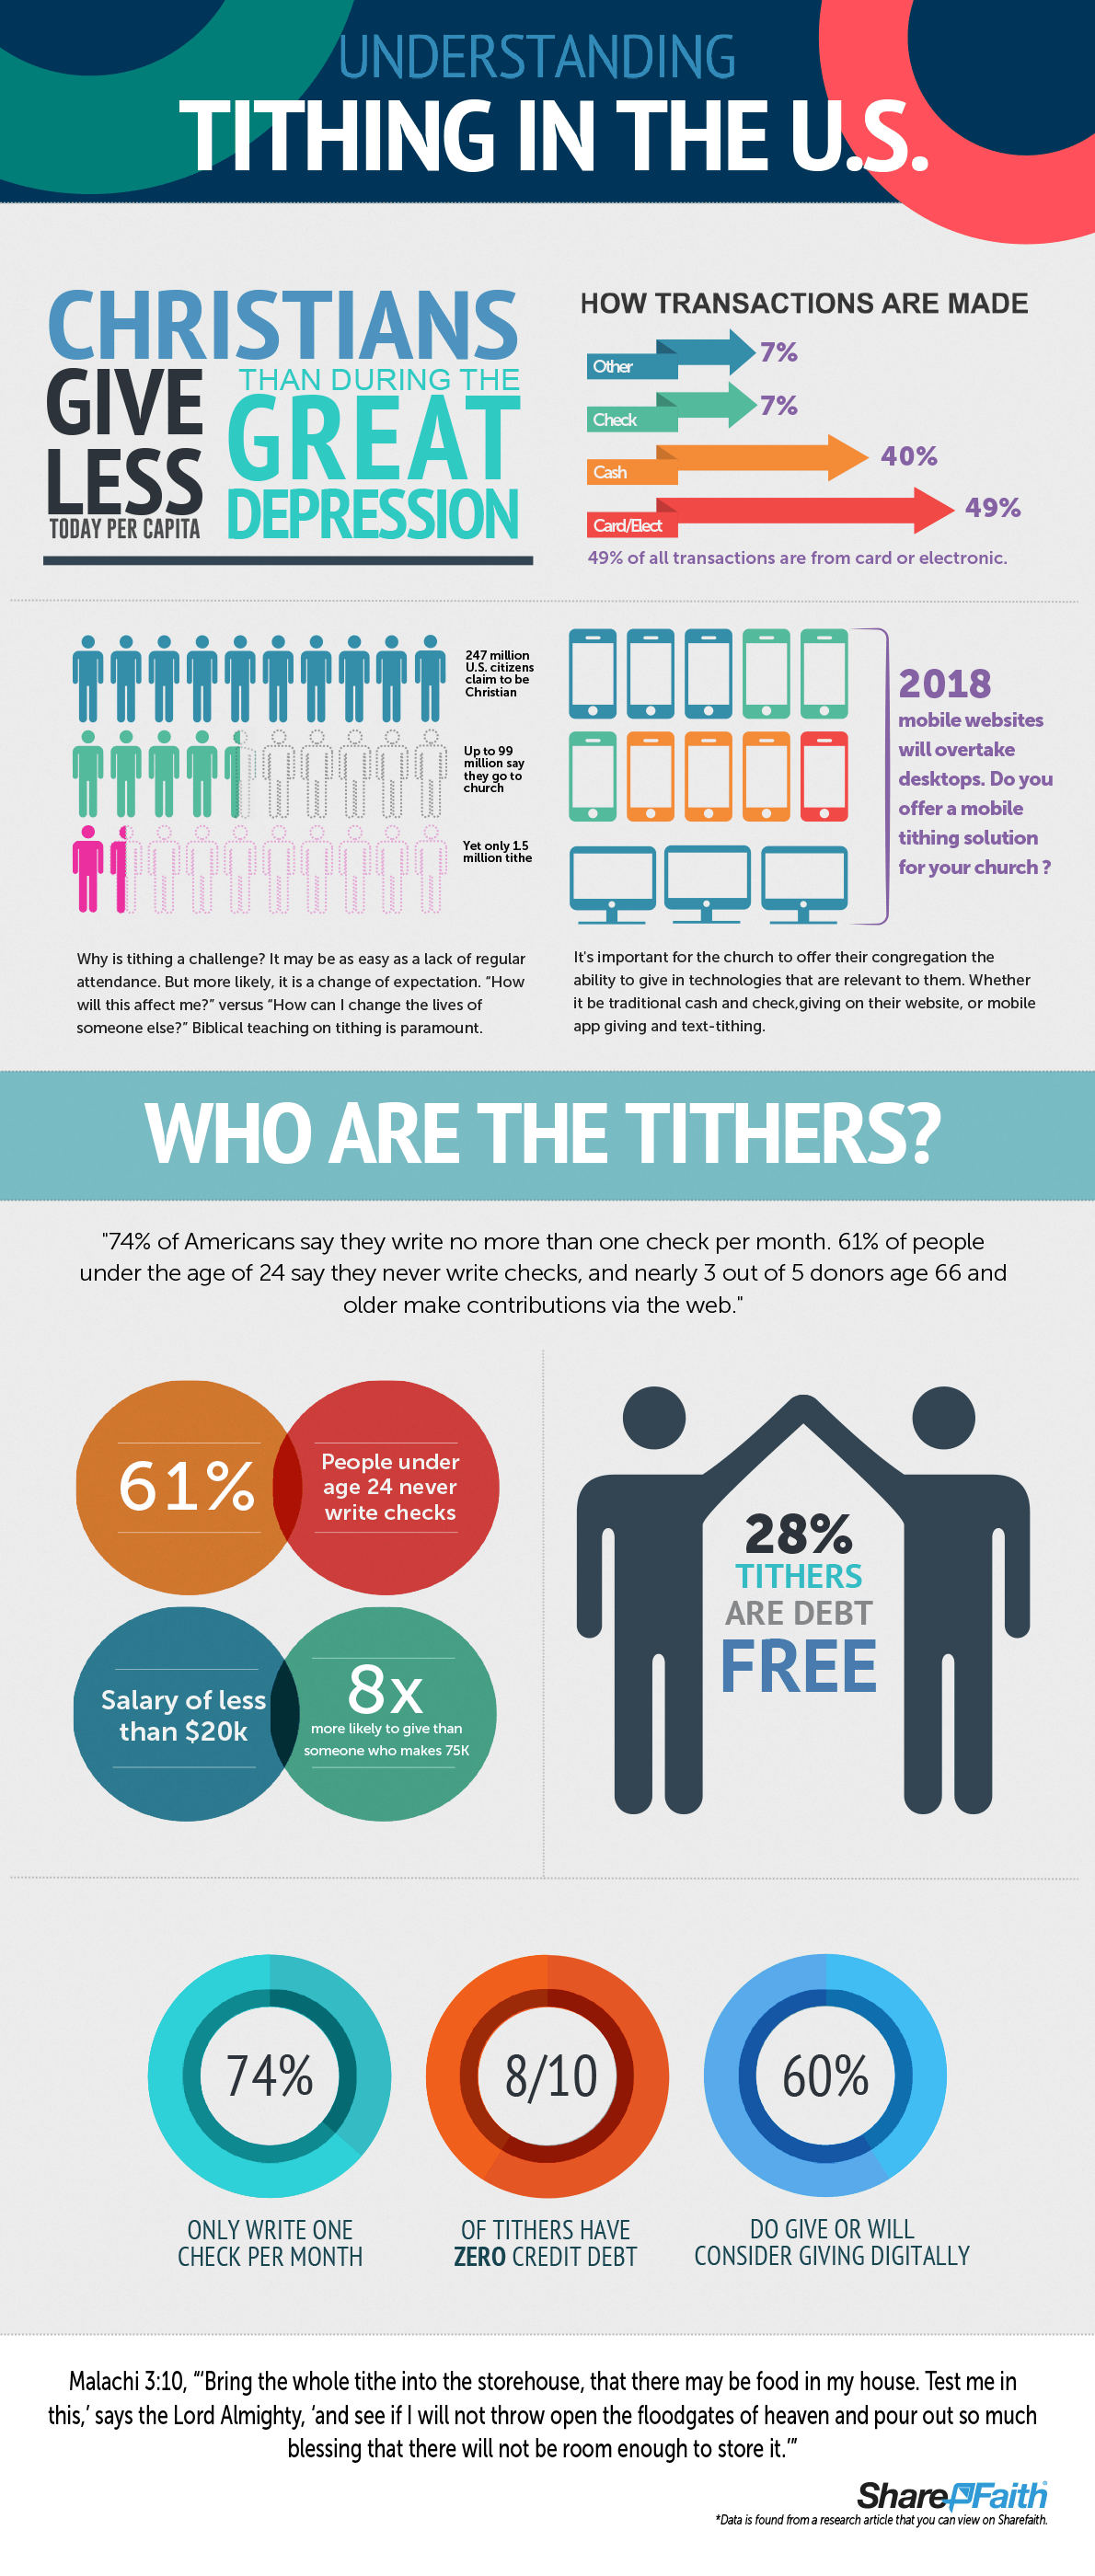
24. Almost half of the tithing comes from cards or electronic payment services.
A total of 49% of tithers donate with credit cards or other electronic payment services. An additional 40% tithe by means of cash, tithe statistics show. The rest use either checks (7%) or other options (7%). A worrisome fact for churches and religious organizations is that Christians today give less than they did during the Great Depression.
(Share Faith)
25. Younger Americans tithe rarely or never.
While 74% of Americans claim to write up to one check a month, 61% of Christians under 24 never write any checks. Another interesting fact here is that those who make less than $20,000 are eight times more likely to give church contributions than those making $75,000.
(Share Faith)
Methodist Church Giving and Tithing Statistics
26. The average annual giving per attendee in Methodist congregations is $2,300.
The annual giving per attendee in the top 200 Methodist churches drastically differ. The lowest yearly donation is about $585, while the highest is $10,773. The average church giving per year is $2,300, whereas the median giving per year is $2,230. These figures change when we focus on the 25 fastest-growing churches. Namely, the annual average church giving per attendee here is lower by 32% at $1,570.
(Horizons)
27. Americans attending Methodist congregations give $44 per week on average.
The difference between the highest and the lowest weekly donations at Methodist churches is significant. Church giving statistics show that the lowest weekly giving is $11, while the highest is $206. These donations make for an average weekly church donation per attendee of $44. Among the 25 fastest-growing Methodist congregations, the average church giving per member is $30 per week, i.e., lower by 32%.
(Horizons)
28. The average debt among the top 200 Methodist churches is $2.75 million.
Church debt statistics show that the average indebtedness of these congregations is over $2.75 million. Only 60 of the top 200 churches carry no debt, while the highest debt goes to a shocking $21.1 million. The median debt is $1.76 million.
(Horizons)
29. Most Methodist churches have a debt to giving ratio under 1.0.
Experts say that churches with a debt to giving ratio under 2.0 should be able to manage their income and expenses. With an average of 0.9, it seems that the majority of Methodist churches have nothing to worry about, as also suggested by giving and tithing statistics. Church revenue statistics, meanwhile, reveal that only 27 among the top 200 Methodist congregations have a debt to income ratio over 2.0. The highest recorded such ratio is 4.7.
(Horizons)
The Bottom Line
Church giving and tithing is more common among the older generations. Even though religious organizations still get most of all money donated in the USA, this trend may change soon. In fact, the average debt to giving ratio for over 10% of the leading Methodist congregations is over 2.0.These church giving statistics show that religious organizations must find new ways to reach donors and tithers. Otherwise, their income from donations can significantly drop as young generations show little to no interest in church giving.
References: Giving USA, Philanthropy Roundtable, Nonprofits Source, U.S. Catholic, USCCB, Forbes, Share Faith, Horizons


Leave a Reply